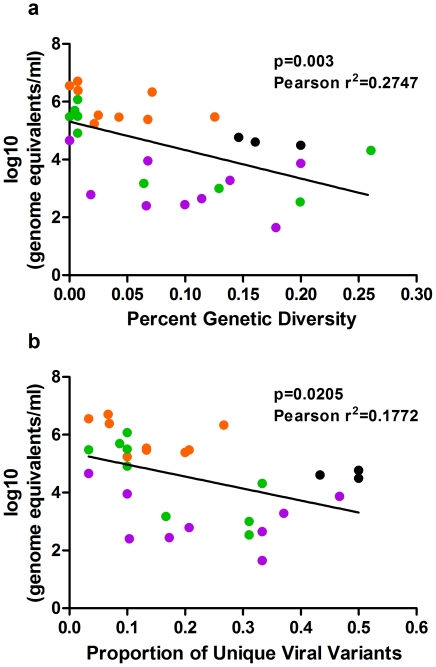
Figure 3. Viral genome equivalents and genetic diversity are inversely correlated.
Black = ‘input’, Orange = midguts, Green = legs, and Purple = saliva. (A) Log transformed genome equivalents for each sample plotted against percent nucleotide diversity, n = 30, p = 0.003, Pearson r2 = 0.2747. (B) Log transformed genome equivalents for each sample plotted against the proportion of unique viral variants, n = 30, p = 0.0205, Pearson r2 = 0.1772.

