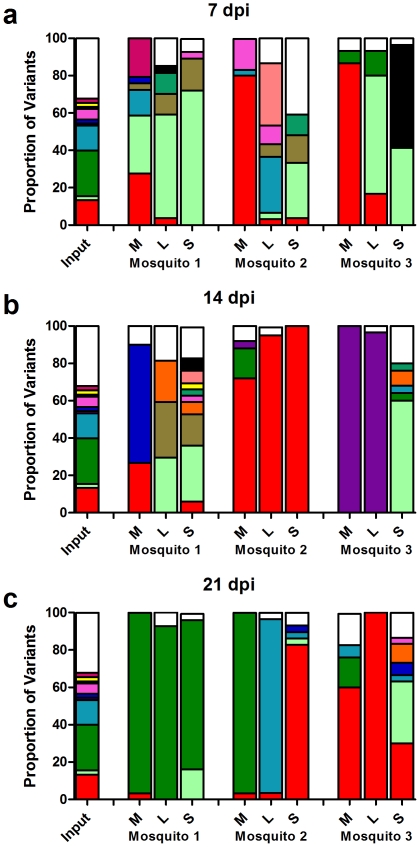
Figure 4. Frequency and location of unique viral variants.
There were 883 clones sequenced, of which 78 sequences were unique. The frequency of the fourteen most common viral variants was mapped back to each sample. The column labeled input combines the data from all three 0 hours post infection mosquitoes. Samples are broken down by days post infection (7 dpi (A), 14 dpi (B), & 21 dpi (C)). Each time point includes three mosquitoes (denoted mosquitoes 1–3) and further broken down by tissue (M (midguts), L (legs), & S (saliva)). The white sections of the histograms represent the remaining 64 uncommon variants and the black sections represent a single nucleotide deletion mutant found in multiple samples.

