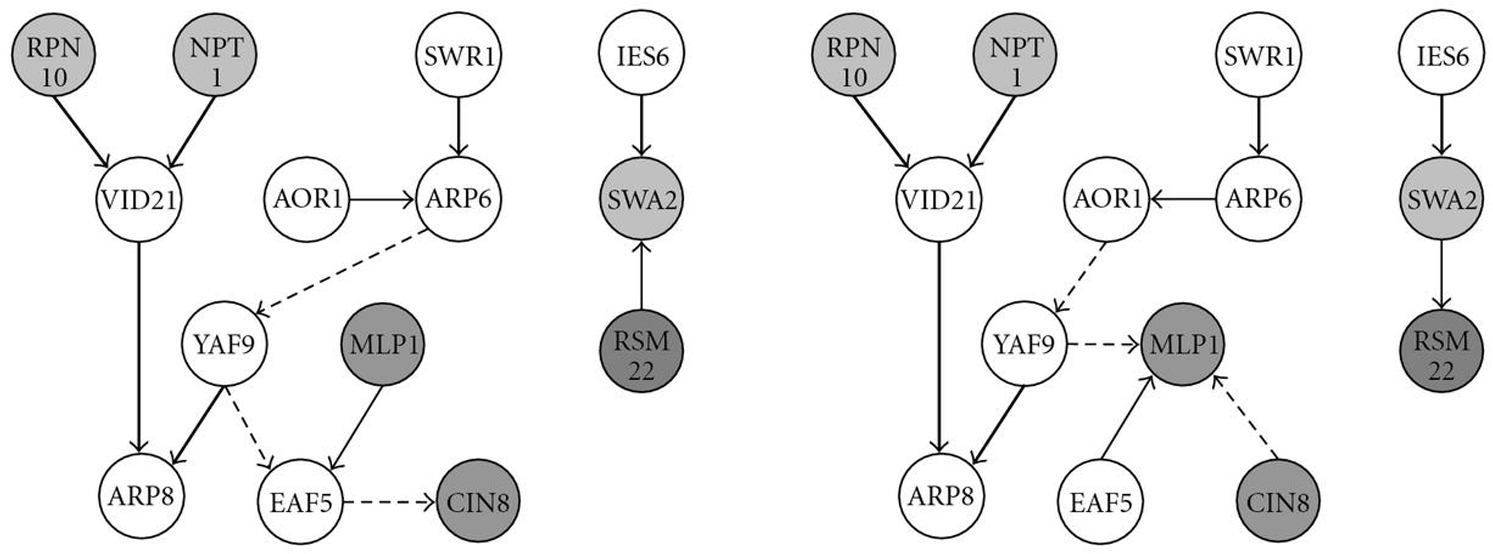
Figure 4.

NEMs constructed from the SL data. Only core genes that have at least one edge are shown. (a) The ML estimate. (b) The Bayesian estimate (the prior choice (see (15)) was  , respectively,
  ). Nodes with the same shading pertain to the same clusters that were defined by Ye et al. [11]. Bold arrows appear in both reconstructions, thin arrows reverse their direction, and dashed arrows are unique to each reconstruction.
