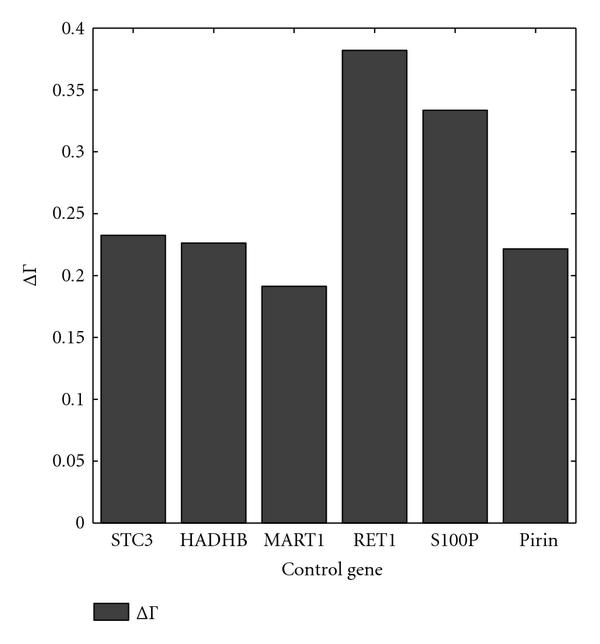
Figure 9.

 is computed for the WNT5A network for various control genes. The switching probability is
  , and the constituent networks are selected with equal probabilities.

 is computed for the WNT5A network for various control genes. The switching probability is
  , and the constituent networks are selected with equal probabilities.