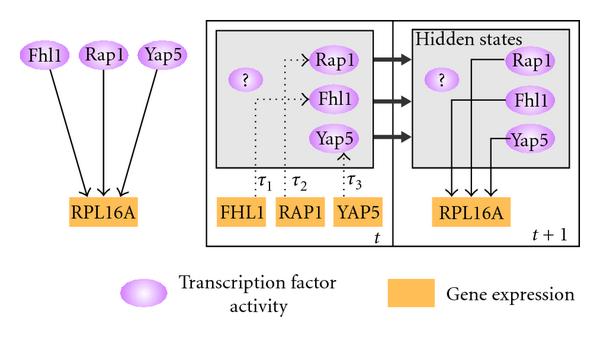
Figure 3.

An example of MISO state-space representation of a multi-input gene regulatory network motif described by Li et al. [14]. The network motif is shown on the left and the corresponding state-space model on the right. Purple ellipses correspond to protein expression, while the orange rectangles signify gene expression. All uppercase names are used for transcripts, and mixed upper-and lowercase is used for transcription factor names. A directed dashed line shows the direction of translation, while a directed solid line represents the direction of transcription regulation.
