Figure 4.

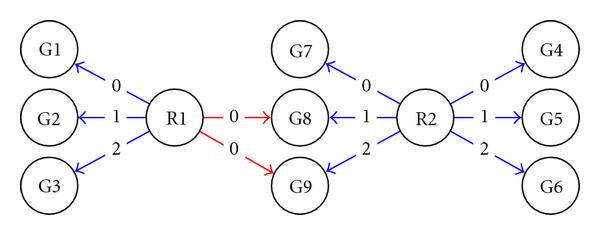
SISO output for artificial data. All edges are labeled with the predicted time delays. A blue edge represents a correct interaction; a red edge represents an incorrect one.

SISO output for artificial data. All edges are labeled with the predicted time delays. A blue edge represents a correct interaction; a red edge represents an incorrect one.