Figure 7.

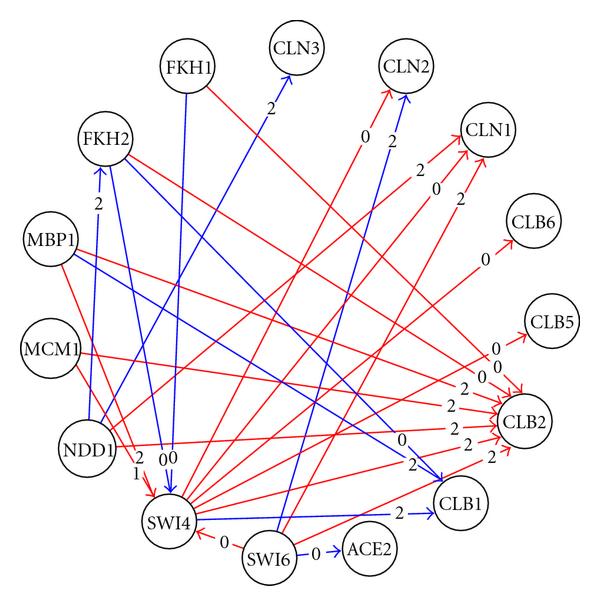
Gene regulatory network for the G1- and G2/M-cyclins. A red edge represents a known interaction based on location analysis and literature search; a blue edge represents an unknown relationship.

Gene regulatory network for the G1- and G2/M-cyclins. A red edge represents a known interaction based on location analysis and literature search; a blue edge represents an unknown relationship.