
Figure 6.
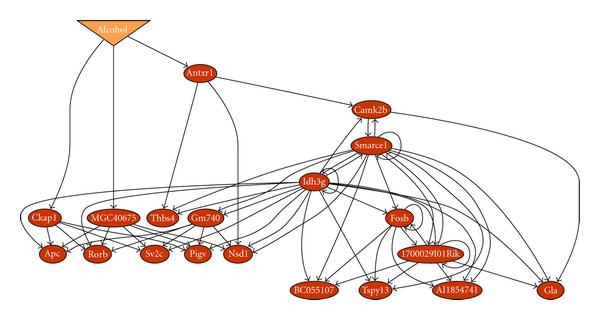
An inferred generalized logical network ( -value
  ). The oval nodes represent genes and the inverse triangle, the binary value of alcohol treatment or control for each subject.
Official websites use .gov
A
.gov website belongs to an official
government organization in the United States.
Secure .gov websites use HTTPS
A lock (
) or https:// means you've safely
connected to the .gov website. Share sensitive
information only on official, secure websites.
An inferred generalized logical network (-value ). The oval nodes represent genes and the inverse triangle, the binary value of alcohol treatment or control for each subject.