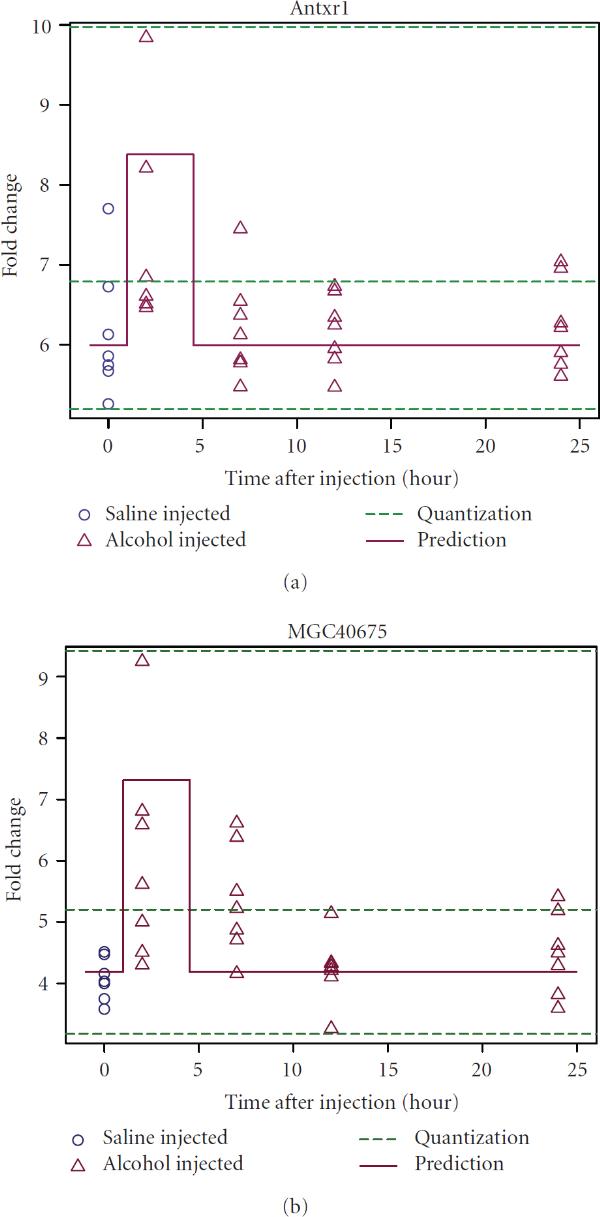
Figure 8.

Agreement of model predicted time courses with observations. Trajectories (solid lines) are predicted from the reconstructed generalized logical network model under the alcohol condition, shown with the observed time course (circle: saline injected, or control; triangle: alcohol injected). The quantization to convert the original continuous fold changes to discrete ones is also displayed as the dashed lines. Both genes showed consistent dynamics between the model prediction and the observation in response to alcohol and are central nodes in the reconstructed gene regulatory network.
