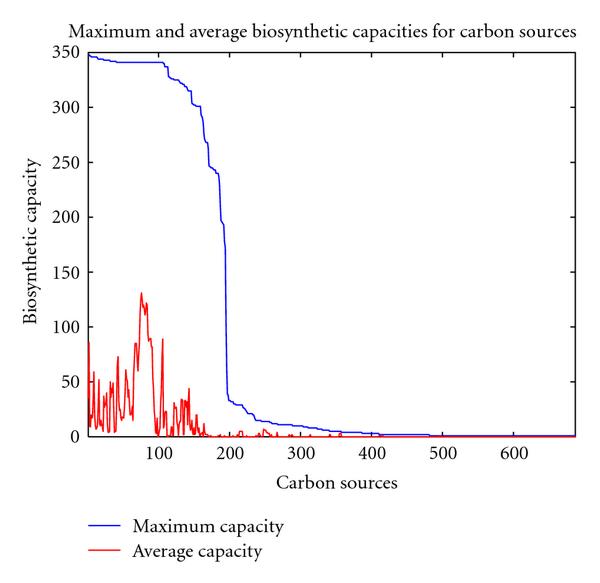
Figure 1.

Biosynthetic capacities for different carbon sources. The blue line displays the maximum capacities found for an organism. The carbon sources are arranged along the  -axis such that the maximal capacities appear in a decreasing order. The red line indicates the capacities for the carbon sources averaged over all considered 447 organisms.
