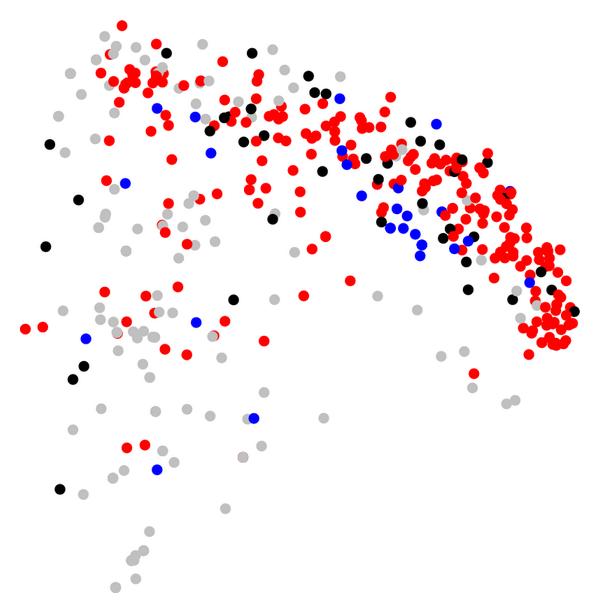
Figure 5.

Similarities of the carbon utilization spectra based on the Jaccard coefficient of the analyzed organisms are represented as a multidimensional scaling plot. Red nodes denote aerotolerant organisms (catalase and super oxide dismutase enzymes present), while blue nodes mark organisms capable of carbon fixation (RuBisCO present). Organisms capable of both are black, while organisms capable of none are grey.
