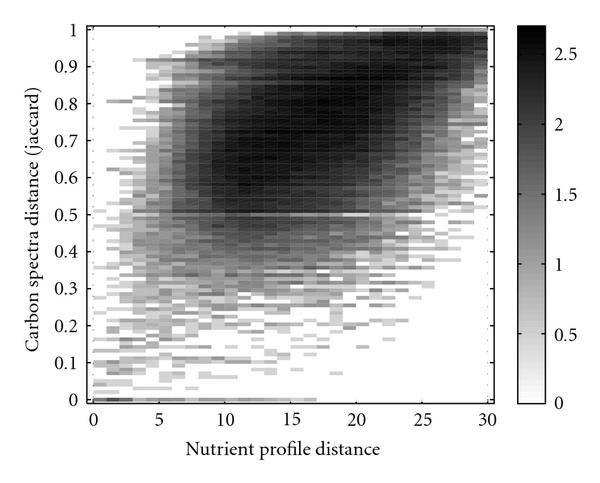
Figure 7.

Comparison of the distance measures obtained from the nutrient profiles and the carbon utilization spectra. A two-dimensional histogram for all pairs of organisms is shown. Black shading indicates a high number of organism pairs sharing certain values of the two distance measures. The shading scale is logarithmic to allow for the visibility of relatively small abundances of combinations of distances.
