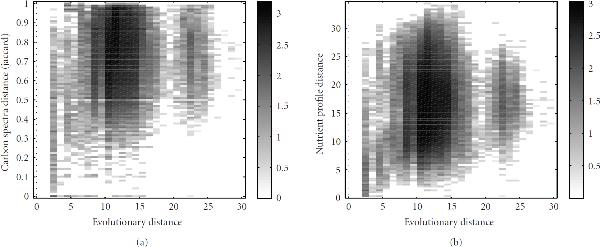
Figure 8.

Comparison of the functional distance measures obtained from (a) the carbon utilization spectra and (b) the nutrient profiles with the evolutionary distance. A two-dimensional histogram for all pairs of organisms is shown. Black shading indicates a high number of organism pairs sharing certain values of the two distance measures. As in Figure 7, the intensity is scaled logarithmically since otherwise large regions would be invisible.
