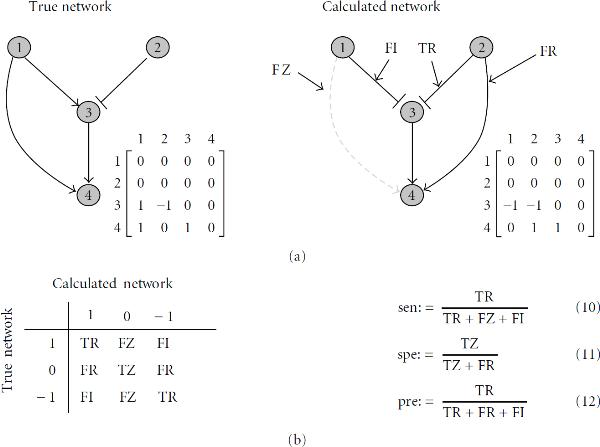
Figure 1.
Definitions. (a) Example of a true (model) network and a calculated network. The adjacency matrix represents the network structure. (b) Left: gene regulatory models have three discrete states ( : activation,
  : inhibition,
  : nonregulation). We consider the kind of regulation (activation or inhibition) in the classification of the results according to the models: TR: True regulation; TZ: True zero; FR: False regulation; FZ: False zero; FI: False interaction. Right: definitions for sensitivity, (10), specificity, (11), and precision, (12).

