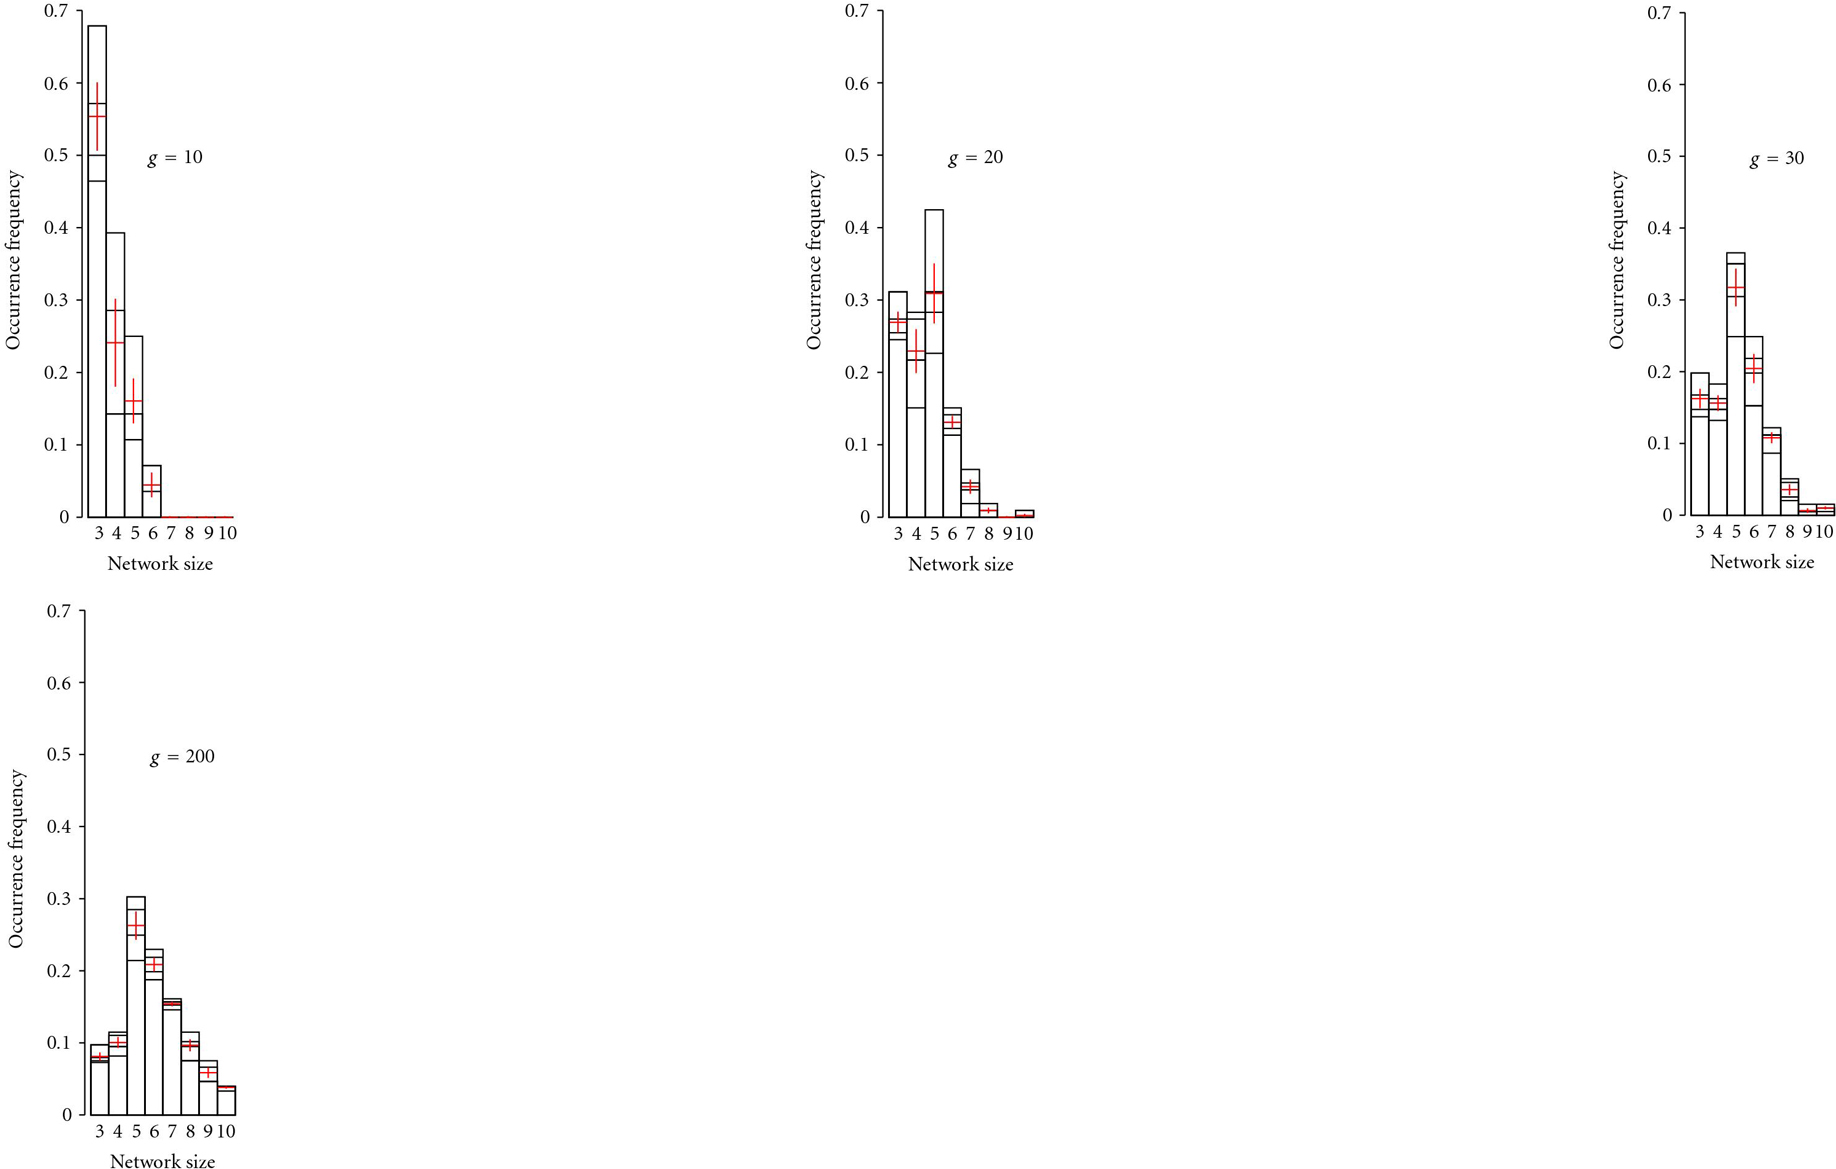
Figure 4.

Distribution of network size as a function of time for adaptation. The distributions of network-size were calculated from 4 repetitions of 2000 runs each, for adaptation times of 10, 20, 30, 200 generations, and an environmental heterogeneity of  . Most prevalent network-size increases with time for adaptation.
