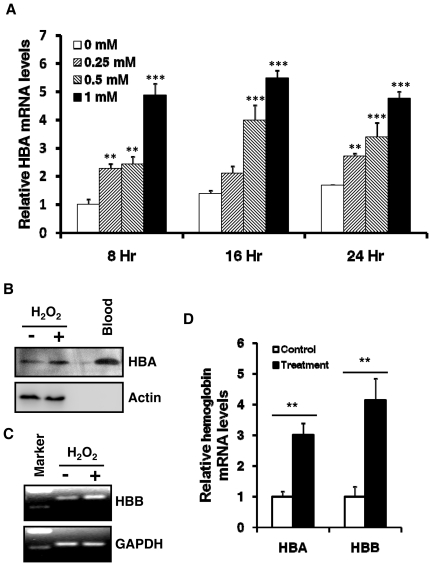
Figure 4. Upregulation of hemoglobin expression by oxidative stress.
A, Induction of hemoglobin expression by H2O2 in a dose dependent manner. HepG2 cells were treated with a series of concentrations (0, 0.25, 0.5, and 1 mM) of hydrogen proxide (H2O2) for 8, 16, or 24 hours. Relative HBA1 mRNA levels were determined by qRT-PCR. Data were expressed as Mean ± SD (n = 3). HBA1 level in control (0mM, 8hr) was normalized to 1. One way ANOVA and Tukey post hoc tests for multiple comparisons were used for analyzing the differences among treatments with different doses. **: p<0.01; ***: p<0.001, when compared to 0 mM treatment. B, HBA1 proteins were induced by H2O2 treatment. Whole cell lysates from HepG2 cells treated with or without H2O2 (1 mM, 48 hours) and blood cells were analyzed for HBA1 protein. Actin was probed as a loading control. C, HBB mRNA was upregulated by H2O2 treatment. HepG2 cells were treated with H2O2 (1 mM) for 48 hours. Reverse transcription PCR products were separated on 2% agrose gel and visualized with ethidium bromide. D, HBA1 and HBB mRNA in HEK293 cells were induced by H2O2 treatment. HEK293 cells were treated with H2O2 (1 mM) for 24 hours and hemoglobin mRNA levels were determined by qRT-PCR. Hemoglobin levels in controls were normalized to 1. Data were expressed as Mean ± SD (n = 3).

