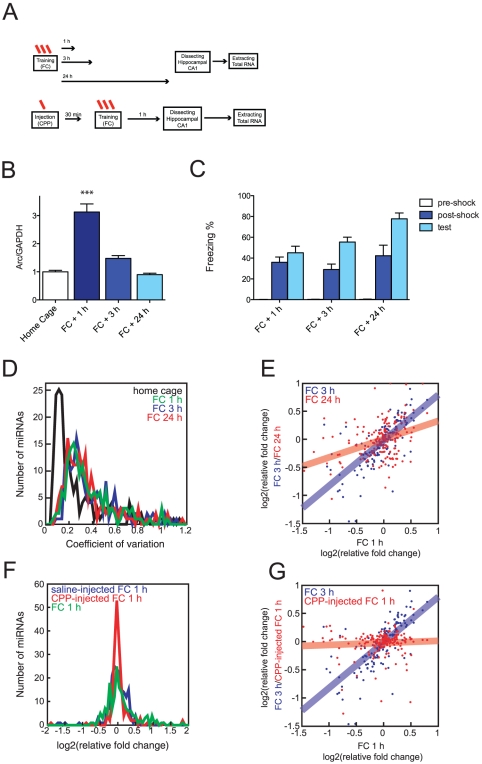
Figure 1. Contextual conditioning induces NMDA-dependent wide scale changes in the global miRNA profile.
(A) Schematic of the experimental design. Mice were trained and memory tested. CA1 region was removed at 1, 3 and 24 hours after fear conditioning (FC). CPP was injected 30 min prior contextual conditioning. (B) Relative Arc transcript levels in CA1 region after training (*** p<0.001, t-test, home cage: n = 12, 1 h and 3 h: n = 12, 24 h: n = 8, mean ± S.E.M.) (C) Contextual fear memory tests at 1, 3, and 24 hr after training. Freezing before (pre-shock) and immediately after shock (post-shock) during the training are also shown. (D) Coefficient of variation of 184 miRNA levels from CA1 region of home caged or fear conditioned animals (1, 3 and 24 hours after training). miRNA levels were more heterogeneous after FC (p<10−14, Kruskal-Wallis test). (E) Comparison of the relative expression changes for individual miRNAs at 3 (blue dots and blue line) and 24 h (red dots and red line) after FC with 1 h after FC. Solid lines are linear fits of the data. Changes were correlated between 1 and 3 h (rS = 0.71, p = 3.10−26) and 24 h (rS = 0.38, p = 7.10−7). (F) Relative mean expression changes of 187 miRNAs 1 h after FC with an injection of a saline solution (blue), of CPP, an NMDA receptor antagonist (red) or without any injection (green). Levels were compared to those of naive animals. Saline-injected and CPP-injected distributions were significantly different (p = 0.02, Kolmogorov-Smirnov test), the distribution of CPP-injected profile is sharper than the saline-injected one (p<10−6, F-test). (G) Comparison of the expression changes 1 h after FC with 3 h after FC (blue dots and blue line) or with injection of the NMDA receptor antagonist, D(–)-3-(2-carboxypiperazine-4-yl)-propyl-1-phosphonic acid (CPP) (red dots and red line). Levels were compared to those of naive animals. Changes in the presence of CPP were minimal and uncorrelated with the ones in conditioned animals (r = 0.06, p = 0.44). The solid line is a linear fit of the data.

