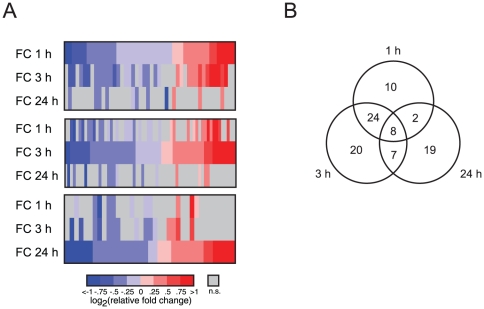
Figure 2. miRNA temporal expression patterns after conditioning in hippocampal CA1 region.
(A) Three heatmaps of miRNA expression after contextual conditioning. They are organized based on time after contextual conditioning. up; 1 h, middle; 3 hrs, down; 24 hrs. (colored miRNAs are statistically significant, n.s. = not significant). (B) Diagram of miRNAs changing after contextual fear conditioning (FC) (p<0.05, Kruskal-Wallis test, home cage: n = 20, 1 h and 3 h: n = 12, 24 h: n = 8.)

