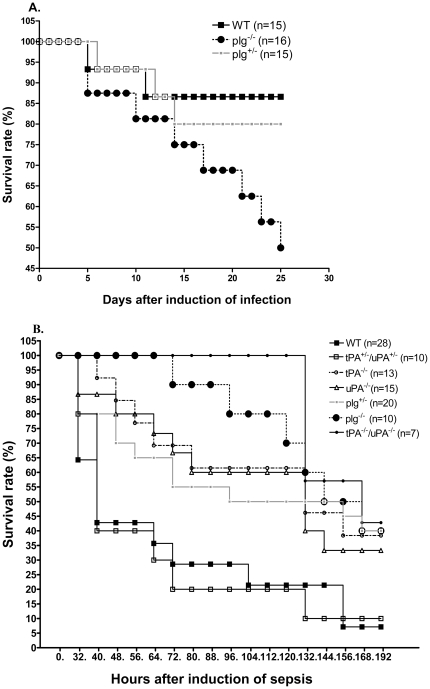
Figure 1. Survival curves of mice with different genotypes during infection and sepsis.
A. Mice were inoculated with 1×10⁷ CFU of S. aureus to induce infection. Survival of WT (n = 15), plg-/- (n = 16) and plg+/- (n = 15) mice was followed for 25 days. Significant differences were found between WT and plg-/- mice (log-rank test, P<0.05). B. Mice were inoculated with 1.6×10⁸ CFU of S. aureus to induce sepsis. Survival of WT (n = 28), tPA+/-/uPA+/- (n = 10), tPA-/- (n = 13), uPA-/- (n = 15), plg+/- (n = 20), plg-/- (n = 10), and tPA-/-/uPA-/- (n = 7) mice was followed for 8 days. Significant differences were found between WT mice and plg-/- mice (log-rank test, P<0.01).

