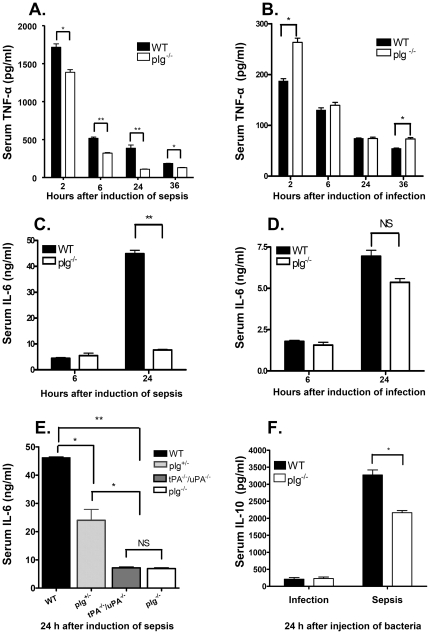
Figure 3. Serum levels of TNF-α, IL-6, and IL-10 during infection and sepsis.
Blood samples were taken at the indicated time points. A. TNF-á levels in sera from WT and plg-/- mice after induction of sepsis. B. TNF-á levels in sera from WT and plg-/- mice after induction of infection.C. IL-6 levels in sera from WT and plg-/- mice after induction of sepsis. D. IL-6 levels in sera from WT and plg-/- mice after induction of infection. E. IL-6 levels in sera from WT, plg+/-, tPA-/-/uPA-/-, and plg-/- mice after induction of sepsis. F. IL-10 levels in sera from WT and plg-/- mice after induction of infection or sepsis. The means ± SD of 5 mice are shown. NS = not significant, * = P<0.05 was considered significant, and ** = P<0.01 was considered extremely significant, by 2-tailed t-test.

