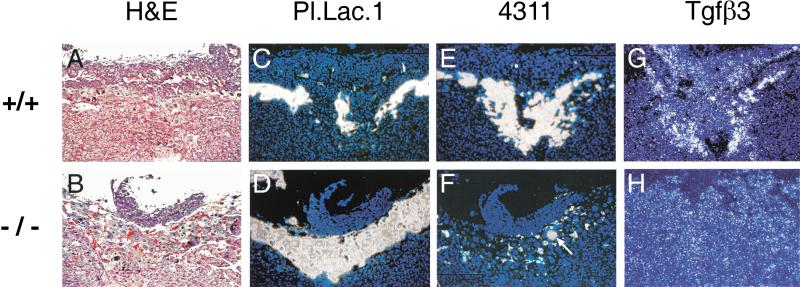
Figure 3.
Presence of cells expressing placental lactogen 1 (Pl.Lac.1), 4311, and TGFβ3 in E9.5 Arnt+/+ and Arnt−/− placentas. (A–H) Sections treated as described for Figure 2. Note the expanded population of giant cells apparent in the sections presented in B and D, and the decreased TGFβ3 expression in H. Magnification, 100×.

