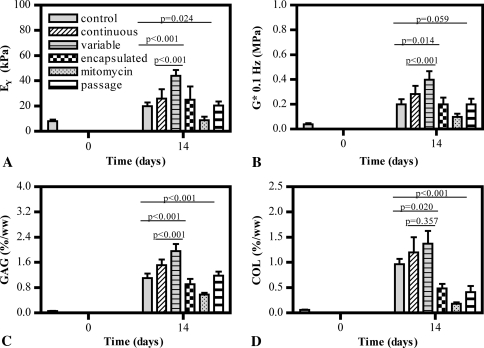
Fig. 6A–D.
Graphs show (A) Young’s modulus (EY), (B) dynamic modulus (G*), (C) GAG content, and (D) collagen (COL) content of constructs with time in culture in Study 3 (n = 5 per group). When the cell monolayer is replaced weekly, increased mechanical properties and biochemical content are achieved by the cocultured tissue constructs.

