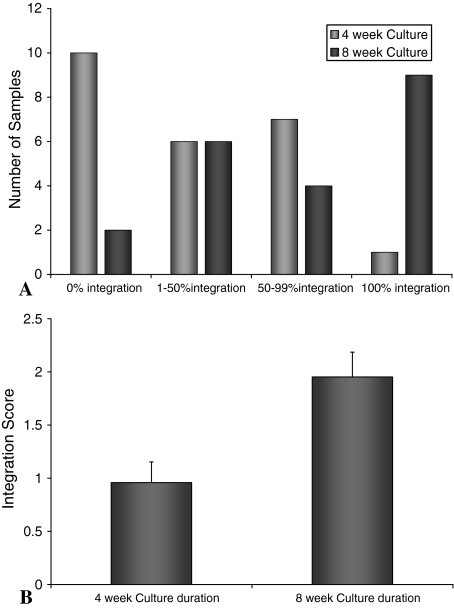
Fig. 5A–B.
The integration of tissue-engineered constructs with surrounding host tissue was evaluated semi-quantitatively. Light microscopy images were assessed for the extent of integration at 4 and 8 weeks. (A) Histogram showing the number of samples demonstrating the percent of integration. The distribution demonstrated a significant increase (p = 0.002) in integration with time when the average integration score at 4 and 8 weeks of culture were compared (B).

