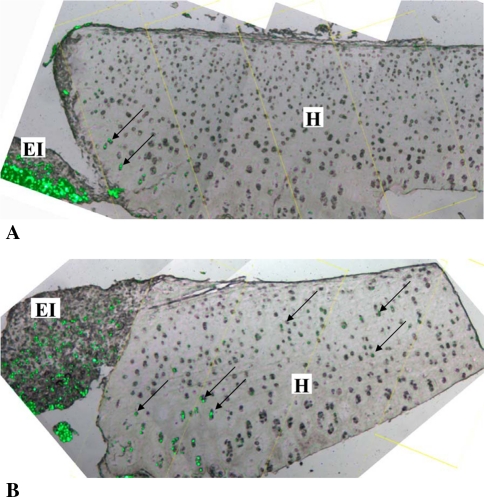
Fig. 9A–B.
Unstained light microscopic and fluorescent images of tissues at (A) 4 and (B) 8 weeks of culture were captured at ×50 magnification and superimposed on each other using Adobe Photoshop CS software Version 8.0 to create a composite image of each sample. Arrows point to carboxyfluorescein diacetate (CFDA)-positive cells (green) that have migrated into the host cartilage. EI = tissue-engineered implant tissue; H = host tissue.

