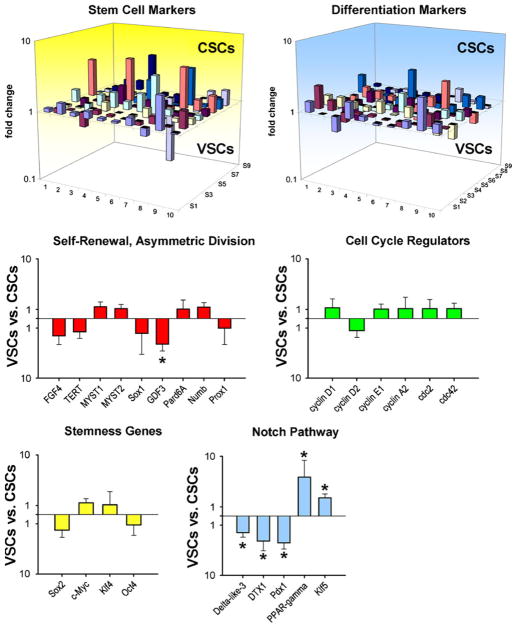
Fig. 3.
Gene expression profile of VSCs and CSCs. Three-dimensional representation of the transcriptional profile of vascular stem cells (VSCs) and cardiac stem cells (CSCs). Bar graphs illustrate the expression of genes discussed in the text. P < 0.05 between VSCs and CSCs. (Taken from ref. 39 with permission)

