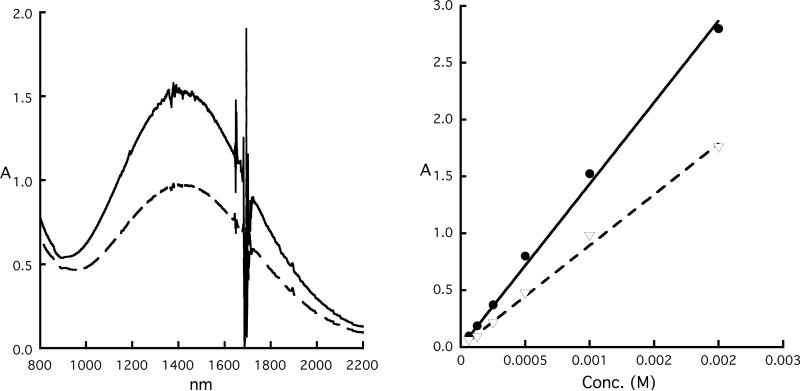
Figure 6.
(Left) UV-vis spectra of equimolar solutions of [Fe(oxoOEC)(Cl)] and [Fe(oxoOEC.)(Cl)]SbCl6 held in the two compartments of a mixing cuvette (“before reaction” spectrum, solid line). “After reaction” spectrum (dashed line) is obtained after the two solutions are mixed, which is essentially identical with that pure of [Fe(oxoOEC./2)(Cl)]2SbCl6. (Right) Plot of the absorbance of “before reaction”(•) and “After reaction”(▽) as functions of concentrations.

