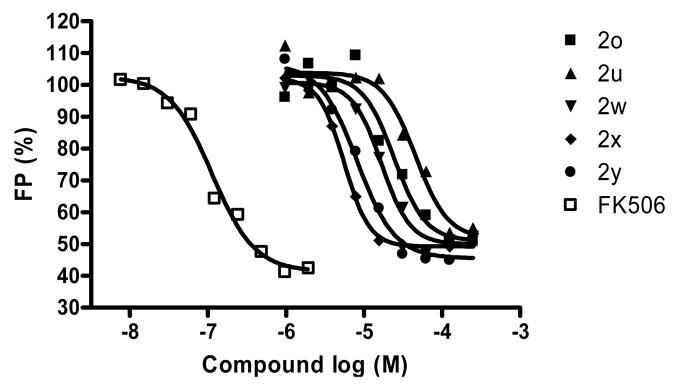
Figure 2.
Representative titration curves showing the competition of FK506 or rapalogs 2o–2y (1–200 μM) with SLF-fluorescein (100 nM) for binding to FKBP12 (200 nM) as monitored by fluorescence anisotropy (FA). The percentage of FA was plotted against the rapalog concentration (in logarithmic scale).

