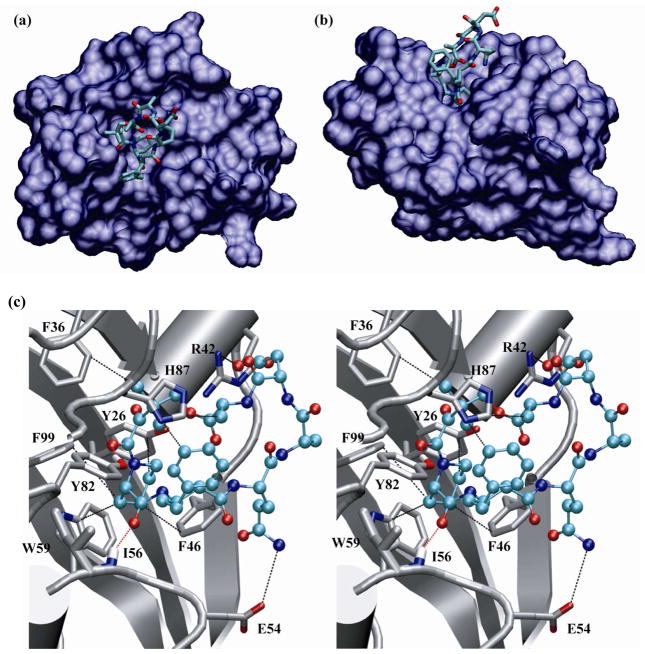
Figure 3.
Top (a) and side view (b) of the overall FKBP12-rapalog 11b complex. FKBP12 is rendered as a surface with a probe radius of 1.4 Å and rapalog is in a licorice representation with hydrogen atoms omitted for clarity. C, O and N atoms are colored in cyan, red, and blue, respectively. (c) Stereo view of the complex between FKBP12 (shown in silver color except for the O and N atoms involved in binding) and rapalog 11c [color scheme: C (cyan), O (red), and N (blue)]. Dash lines indicate intermolecular hydrogen bonding, electrostatic, and CH-π interactions between the rapalog and the active-site residues of FKBP12.

