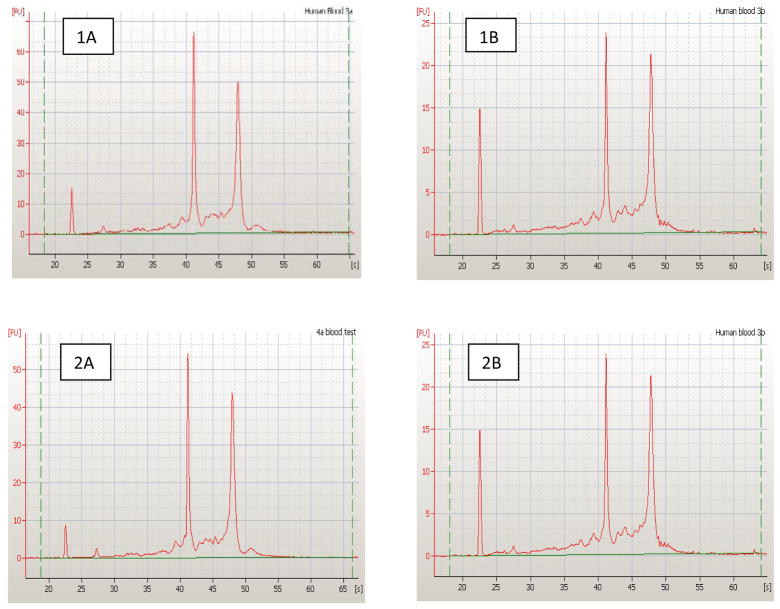
Figure 3.
Assessment of total riboneucleic acid (RNA) quality for whole blood. Fresh samples (marked as 1A and 2A) and frozen samples (marked as 1B and 2B) samples of total RNA were analyzed by capillary electrophoresis (Agilent Bioanalyzer). Shown for each sample is the electropherogram indicating florescent intensity on y-axis vs. time (sec) on x-axis. The 2 major peaks correspond to the 18s (at ~ 42 sec) and the 28s (at ~ 48 sec) ribosomal peaks and indicate high quality total RNA.

