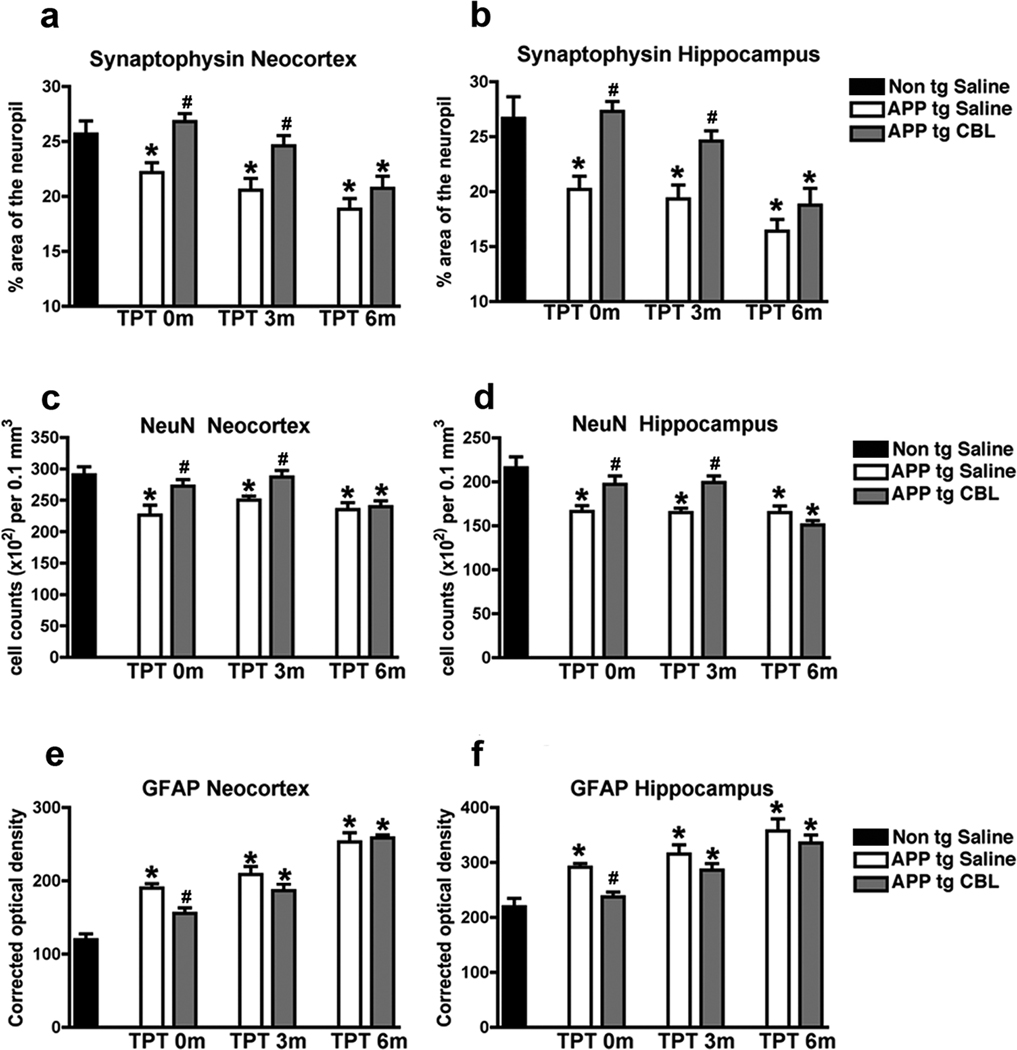
Fig 2. Effects of CBL in the markers of neurodegeneration 3 and 6 months after therapeutical interruption in APP tg mice.
Immunohistochemical analysis was performed to evaluate the effect of CBL treatment interruption on neurodegeneration in APP tg mice. (a) Levels of the synaptic marker, synaptophysin, in the neocortex of saline-treated non tg and saline or CBL-treated APP tg mice at TPT 0m, TPT 3m and TPT 6m. (b) Levels of synaptophysin, in the hippocampus of saline-treated non tg and saline or CBL-treated APP tg mice at TPT 0m, TPT 3m and TPT 6m. (c) Levels of the neuronal marker, NeuN, in the neocortex of saline-treated non tg and saline or CBL-treated APP tg mice at TPT 0m, TPT 3m and TPT6m. (d) Levels of NeuN, in the hippocampus of saline-treated non tg and saline or CBL-treated APP tg mice at TPT 0m, TPT 3m and TPT 6m. (e) Levels of the astroglial marker, GFAP, in the neocortex of saline-treated non tg and saline or CBL-treated APP tg mice at TPT 0m, TPT 3m and TPT 6m. (f) Levels of GFAP, in the hippocampus of saline-treated non tg and saline or CBL-treated APP tg mice at TPT 0m, TPT 3m and TPT 6m. Error bars represent mean ± SEM. (*)Indicates p<0.05, when comparing APP tg mice with saline-treated non tg mice assessed by one-way ANOVA with post-hoc Dunnett’s and (#) indicates p<0.05 when comparing CBL-treated APP tg mice with saline-treated APP tg mice assessed by one-way ANOVA with post-hoc Dunnett’s.

