
Figure 6.
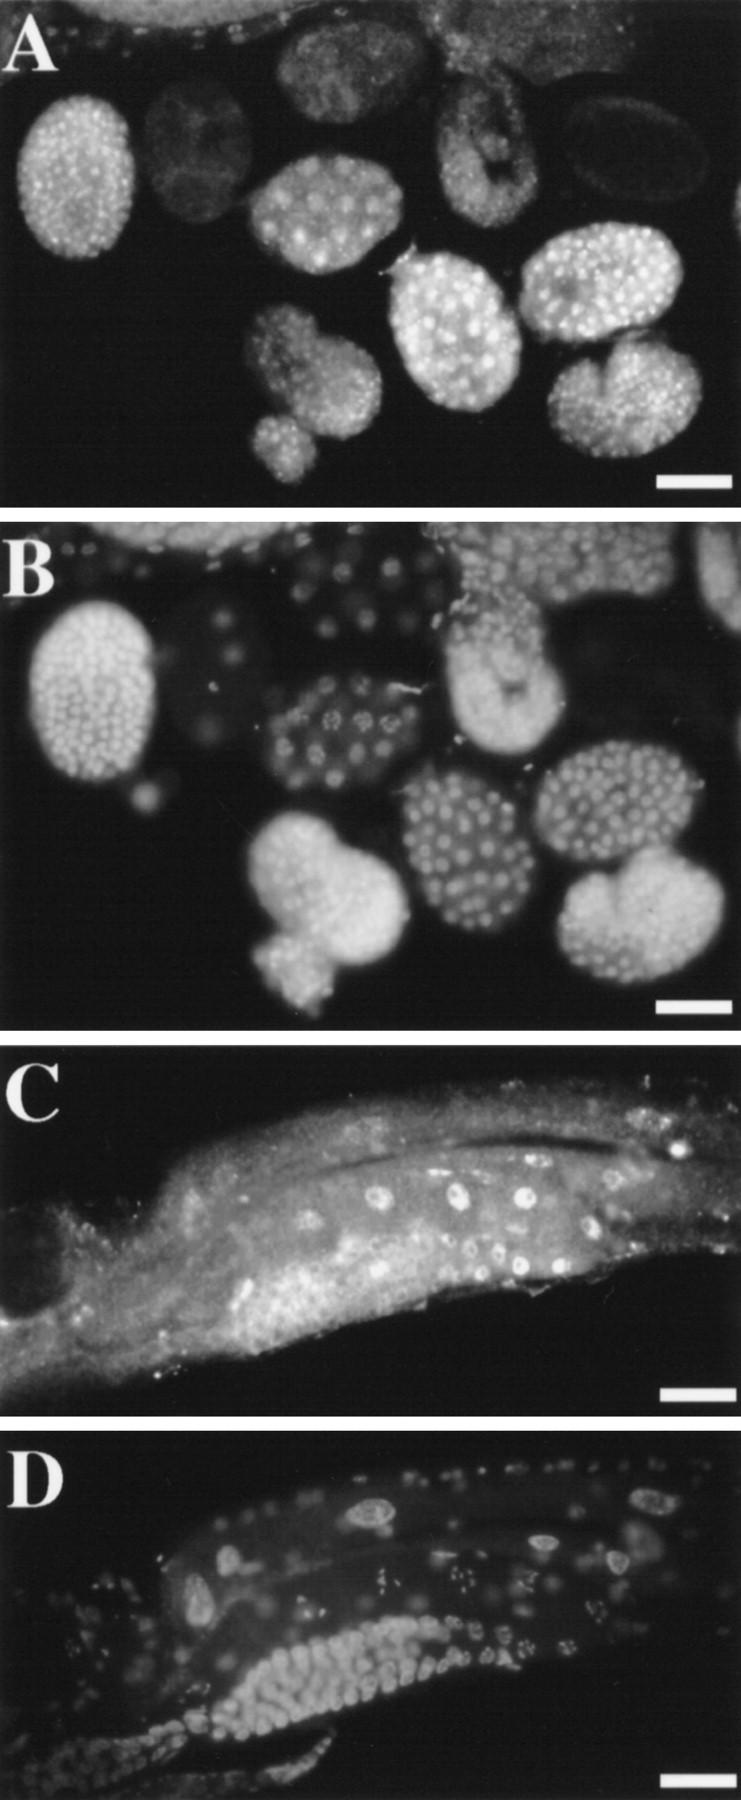
Immunofluorescence detection of TAM-1 protein in nuclei. (A) Embryo population and (C) an adult stained with mouse anti-TAM-1 and visualized with a secondary goat anti-Cy3 antibody. (B,D) Corresponding images of DNA localization, visualized with DAPI. Photos shown are from antisera to TAM-1 residues 594–712. Similar results were seen with antisera to TAM-1 residues 778–856. Signal in C has been augmented by electronic contrast enhancement. Scale bars, 27.5 μm.