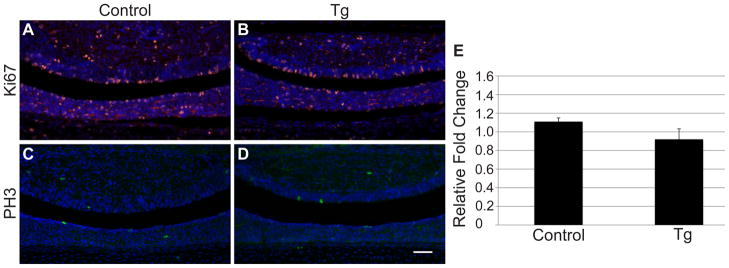
Figure 6.
Proliferation is unaffected by persistent NICD expression. Ki67 immunohistochemistry was performed on p1 control (A) and Tg pituitaries (B) and no difference in immunoreactivity (red) was observed. Similarly, no difference in Phopho-histone-H3 immunoreactivity (green) was observed between control (C) and Tg (D) pituitaries at p1. Nuclei are visualized with DAPI staining (blue; A-D). Additionally, qRT-PCR showed no change in Myc mRNA levels between control and Tg pituitaries at p1 (E). Photos taken at 200x. Scale bars: 50μm. n=4–5 (immunohistochemistry) and n=4 (RT-PCR).

