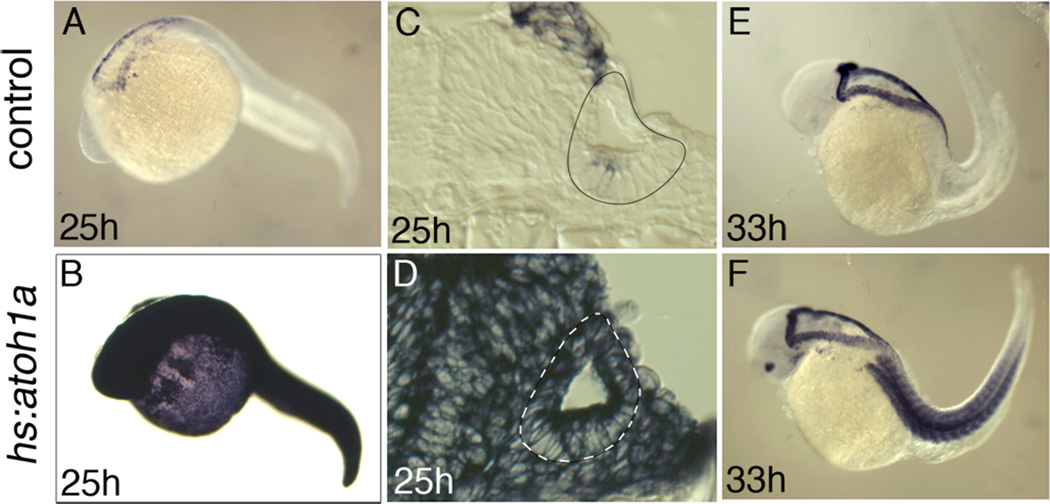
Figure 1. atoh1a expression following hs:atoh1a activation at 24 hpf.
Expression of atoh1a at the indicated times in control embryos (A, C, E) and hs:atoh1a transgenic embryos (B, D, F). Images of wholemount specimens (A–B, E–F) are dorsolateral views with anterior to the left and transverse sections (C–D) with dorsal to the top. The otic vesicles are outlined in C–D.

