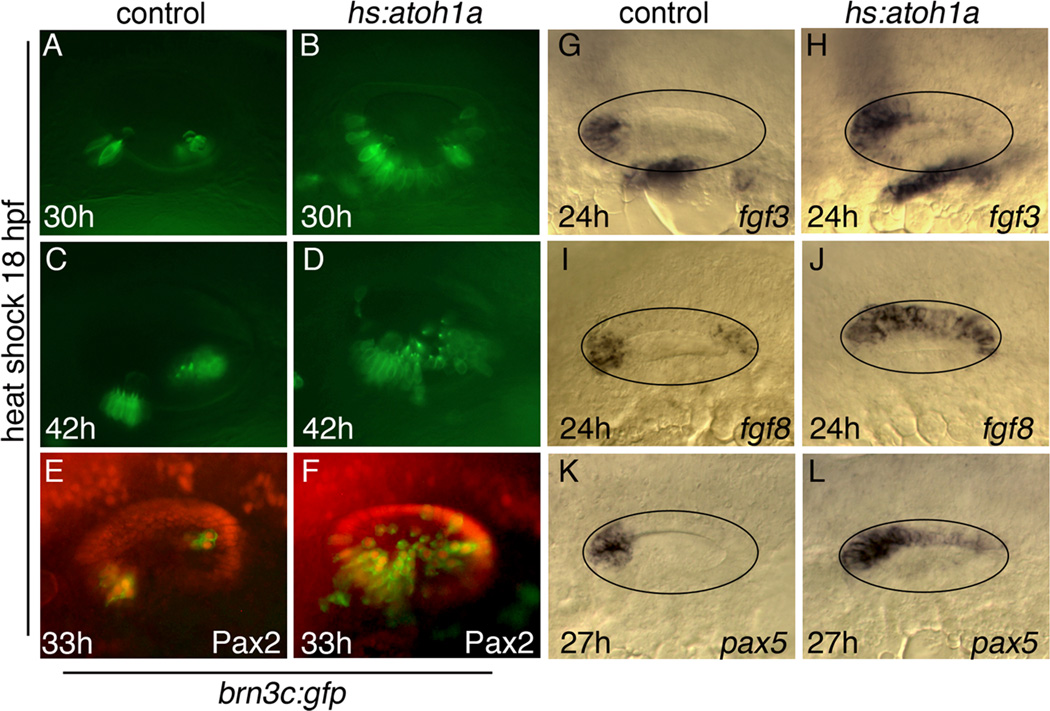
Figure 2. Otic vesicle patterning following hs:atoh1a activation at 18 hpf.
(A–F) Expression of brn3c:gfp (green) in the utricle and saccule of control embryos (A, C, E) and in hs:atoh1a transgenic embryos (B, D, F) at the indicated times. (E, F) Co-staining with anti-Pax2 in red. (G–L) Otic expression of fgf3, fgf8, and pax5 in control embryos (G, I, K) and expanded expression in hs:atoh1a transgenic embryos (H, J, L). All images show dorsolateral views with anterior to the left and dorsal up (A–H) or dorsal views with anterior to the left and medial up (I–L).

