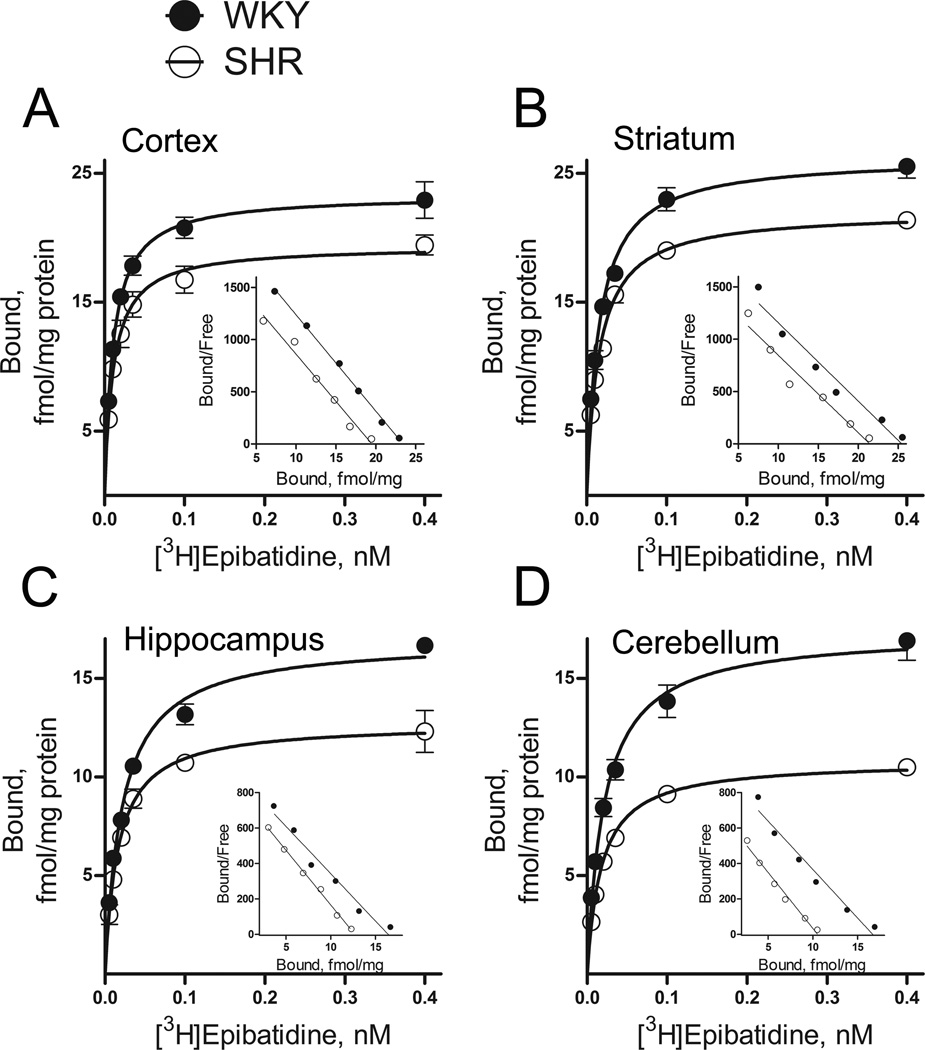
Figure 1.
Specific [3H]epibatidine binding to SHR and WKY membranes from cortex (A), striatum (B), hippocampus (C) and cerebellum (D). Corresponding Scatchard plots are shown in the inset. Maximum binding sites (Bmax) were lower in SHRs compared to WKY rats in all four brain regions, with no significant difference in dissociation constants (Kd values). In cortex, Bmax values were 19.8 ± 1.0 and 24.1 ± 0.5 fmol/mg protein (p < 0.05), with Kd = 11.6 ± 0.9 and 11.8 ± 0.5 pM for SHR and WKY respectively (p > 0.05). In striatum, Bmax values were 22.1 ± 0.3 and 26.4 ± 1.0 fmol/mg protein (p < 0.01), with Kd = 15.7 ± 1.3 and 15.9 ± 1.9 pM for SHR and WKY respectively (p > 0.05). In hippocampus, Bmax values were 12.8 ± 0.8 and 17.0 ± 0.3 fmol/mg protein (p < 0.05), with Kd = 16.6 ± 2.1 and 21.9 ± 2.7 pM for SHR and WKY respectively (p > 0.05). In cerebellum, Bmax values were 10.8 ± 0.4 and 17.4 ± 1.4 fmol/mg protein (p < 0.0001), with Kd = 17.7 ± 2.1 and 21.7 ± 2.6 pM for SHR and WKY respectively (p > 0.05). Membranes (~0.1 mg protein) and [3H]epibatidine were incubated for 3.0 hours at 23°C. Non-specific binding was determined in the presence of 100 µM nicotine. Each data point represents mean ± SEM of 3 to 4 rats.

