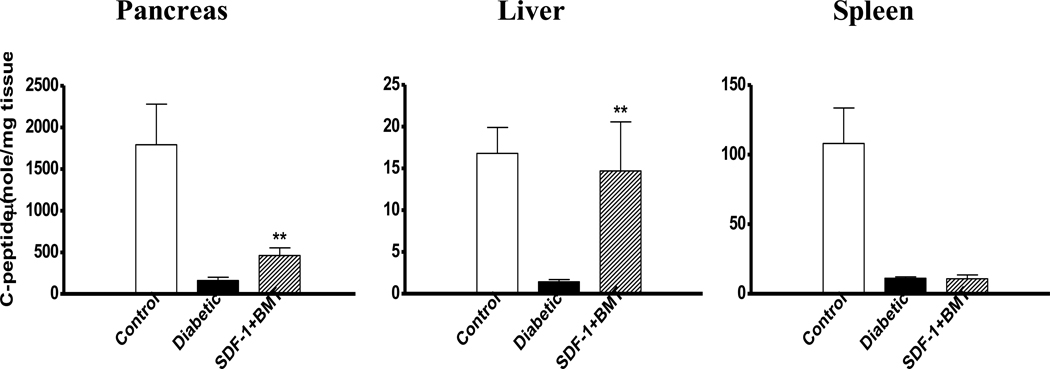
Figure 6. Determination of C-peptide levels in different tissues.
Insulin production in pancreas, liver and spleen of control non-diabetic, diabetic, and diabetic mice treated with SDF-1 and BMT. All tissues from diabetic mice without treatment had the lowest C-peptide content. Combined SDF-1+BMT significantly increased C-peptide levels in the pancreas, while its concentration in the liver was even higher and comparable to control non-diabetic mice (**P<0.05 compared to diabetic mice).

