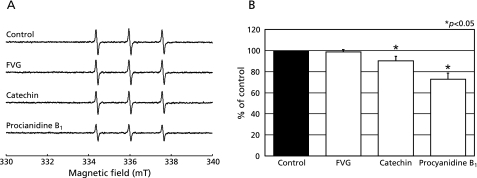
Fig. 5.
Effects of FVG, PB1 and catechin on 1O2 generated by illuminated rose bengal. A, ESR spin trapping measurement of 1O2 produced by the photochemical reaction of rose bengal illuminated for 2 min (18,000 lux) with 4-oxo-TEMP (40 mM) as the spin trap (a) in the absence of antioxidant; control with FVG (b; 100 µg/ml), catechin (c; 100 µg/ml), and PB1 (d; 100 µg/ml) pre-treatment, respectively. B, the effects of FVG, catechin, and PB1 on 1O2 generated by illuminated rose bengal. The signal intensity of the second peak of the spectrum was normalized as the relative height against the signal intensity of a control. Results are expressed as percent of control and are represented as mean ± SEM. * indicates a significant difference (p<0.05) versus the corresponding control value.

