Fig. 2.
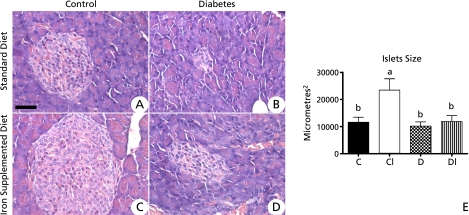
Photomicrographs of histological pancreatic sections. (A) Control group. (B) Diabetic group. Note the decrease of the size of pancreatic islets as compared to the control group. (C) Control group receiving the iron supplemented diet and showing significant increase of pancreatic islets as compared to all other groups. (D) Diabetic group receiving iron supplemented diet. Note the decreased size of pancreatic islet as compared to the control group. Hematoxylin & Eosin staining. Bar = 50 µM. Figure E- Average size of pancreatic islets from hamsters fed standard diet (C), diet supplemented with carbonyl iron (CI), diabetes (D) and diabetes supplemented with carbonyl iron (DI)*.
* Values are mean ± standard deviation (n = 6). Data were analyzed by bivariate ANOVA analysis. When one of the factors was significant (p<0.05), univariate analysis with Tukey post test was performed to determine specific differences between means. Statistical differences are shown by different superscript letters.

