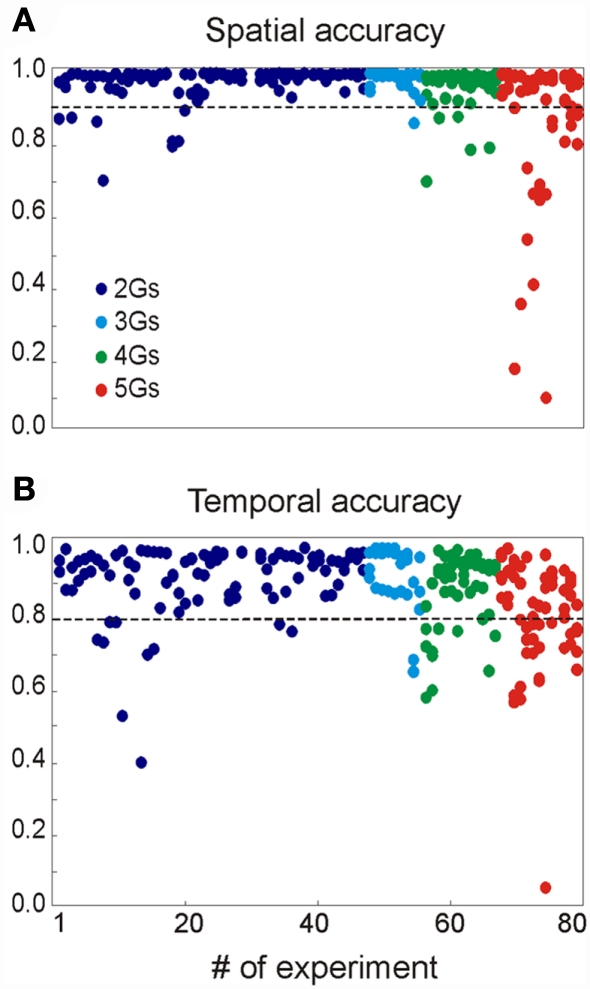
Figure 3.
Summary of the results obtained for 80 multisynaptic LFPs. The plots show the spatial (A) and temporal (B) accuracy of each generator derived from mixed LFPs when compared to their values alone (see Methods). The values of the different generators obtained in each simulation are represented by the dots in the same vertical position. The parameters for the synaptic combinations can be found in the Appendix.

