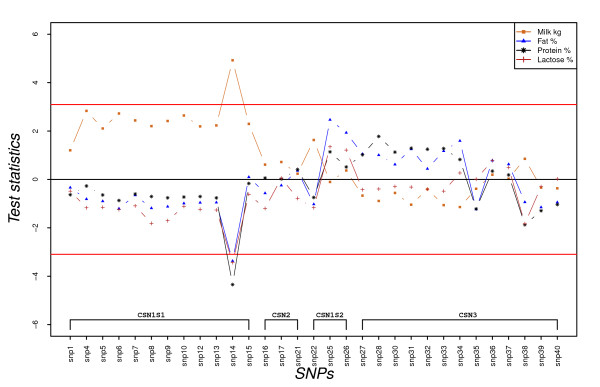
Figure 3.
SNP's dominance effect on milk production in kg, protein %, fat % and lactose % expressed as test statistics for frequent alleles. Test statistics (estimated effects divided by their standard errors) are embedded in the y-axis; the horizontal lines indicate 5% experiment-wise level of significance and any SNP having a test statistic value for a trait above the top line or below the bottom line indicates that it has a significant effect on the trait.

