Figure 2.
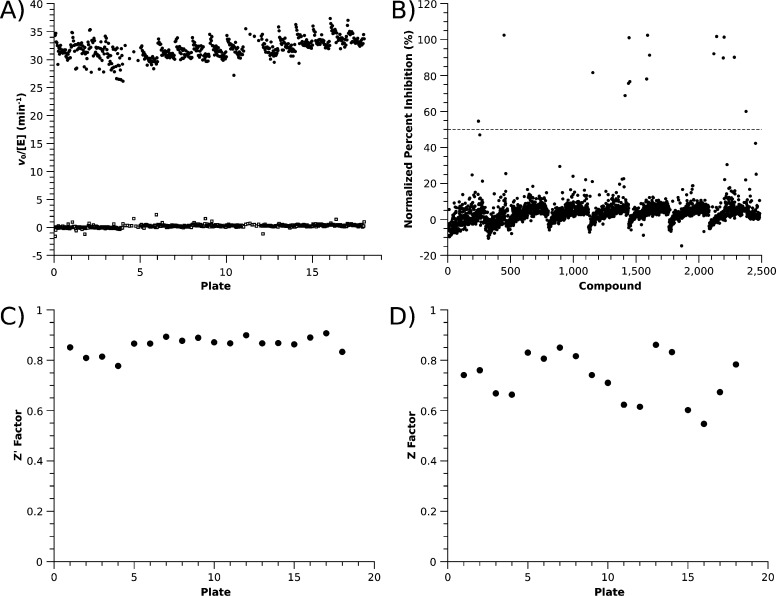
HTS results. (A) Single-well positive controls containing DDAH (20 nM, ●) for all plates screened are compared with negative controls containing no enzyme (◻). (B) Mean percent inhibition of duplicates for all library compounds screened. The dashed line represents the cutoff for “hits” (50%). (C) Per plate Z′ factors. (D) Per plate Z factors. See the Supporting Information for details.

