Figure 3.
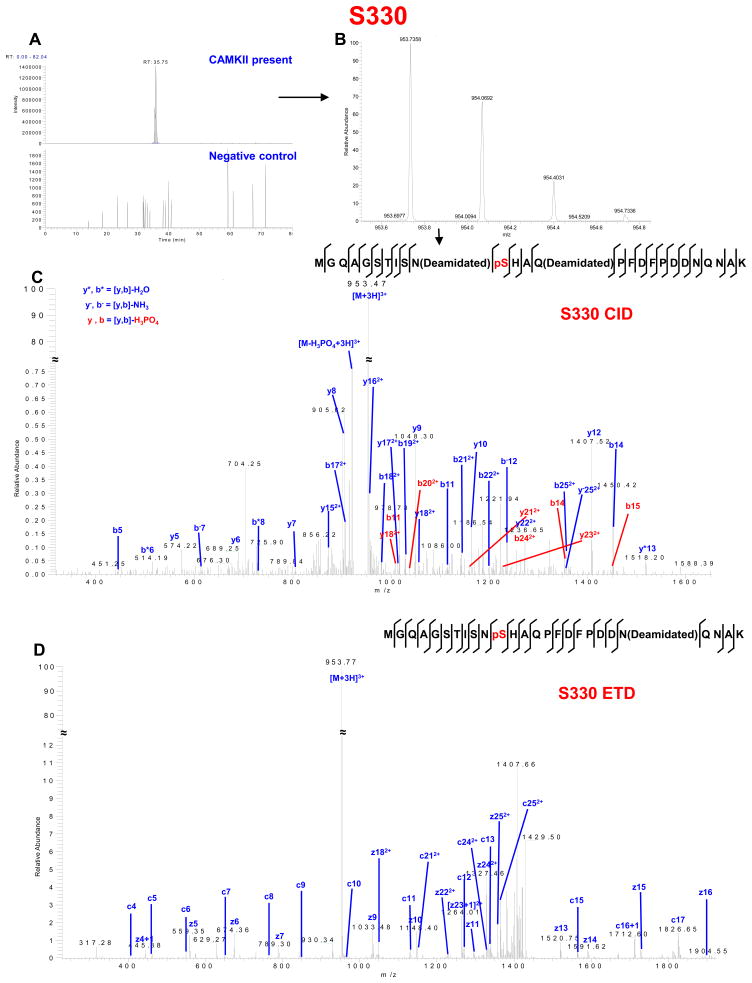
CaMKII phosphorylation of Cx43-CT at S330. (A) Extracted chromatogram of m/z 953.7332–953.7428. (B) MS spectrum of m/z 953.7358 represents triply charged peptide MGQAGSTISNSHAQPFDFPDDNQNAK (one phosphorylation site, two deamidated sites). (C) CID MS2 spectrum indicates phosphorylation on S330. (D) ETD MS2 spectrum indicates phosphorylation on S330. See Supplemental Table S3 for complete list of theoretical (ProteinProspector) and observed fragment ions.

