
Figure 2.
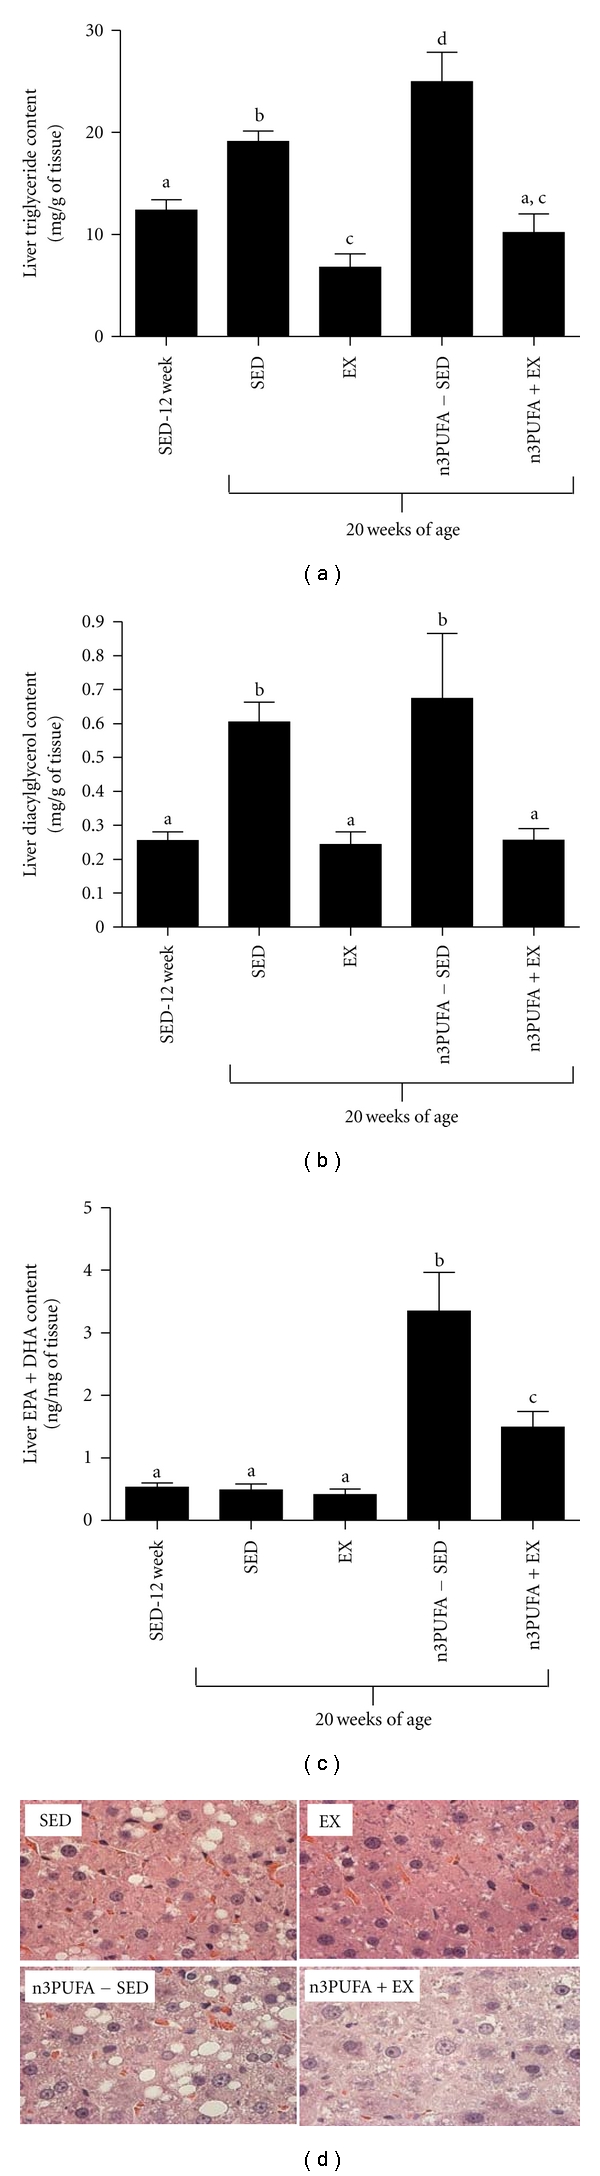
Hepatic fat storage. Fat accumulation in the liver as shown by liver triglyceride content (a), liver diacylglycerol content (b), liver n3PUFA content (EPA + DHA) (c), and representative images of hematoxylin and eosin staining for lipid vacuolization (d). Values are means ± SE (n = 8). Values with different letter superscripts are significantly different from each other (P < 0.05).