
Figure 6.
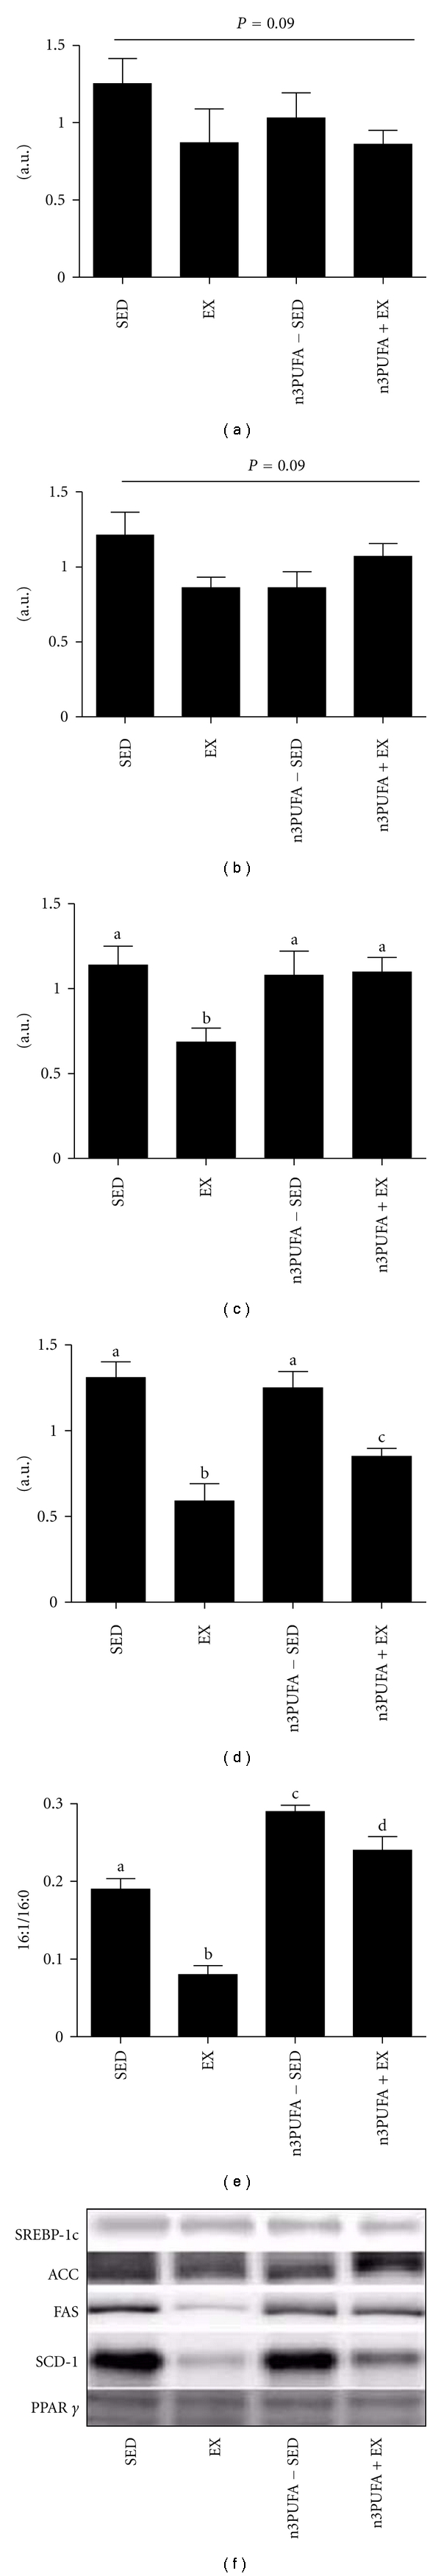
Lipogenic markers. Protein content of nuclear SREBP-1c (a), ACC (b), FAS (c), SCD-1, and PPARγ (d). Representative blots are shown in (f) for each of the target proteins. Desaturase index is indicative of SCD-1 desaturase activity and is shown by the ratio of 16 : 1 to 16 : 0 (e). Values with different letter superscripts are significantly different from each other (P < 0.05).