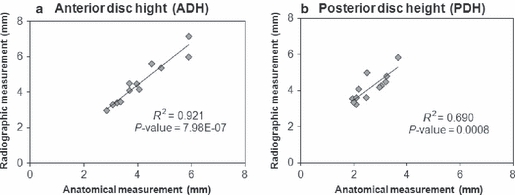
Fig. 2.

Correlations between anatomical and radiographic measurements of the anterior (a) and posterior (b) disc heights considering mean values from each disc level from C7–T1 to T11–12. See Table 1 for data summaries. ADH, anterior disc height; PDH, posterior disc height.
