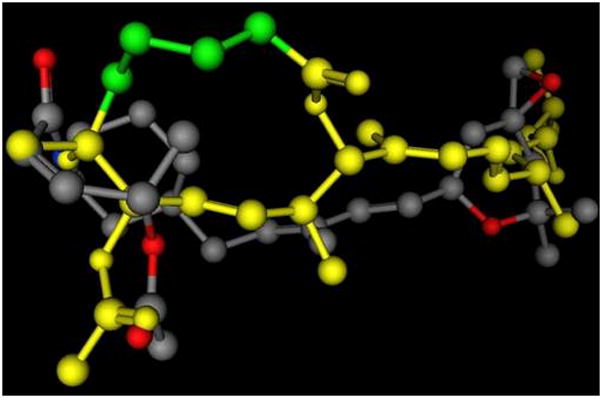
Figure 2.

A 3D representation of an example of an overlay of the presumed key interaction groups in a low energy conformation of 3-deoxypladienolide (shown in yellow, some atoms are not shown) and compound 6, showing that the epoxy group and the carbonyloxy groups are the same distance in both molecules. In the pladienolide model the C2 through C5 carbons are highlighted in green. This alignment represents the best S value (S=167.18) for molecules matching the hypothetical pharmacophore, and the second best overall of 69 alignments from 500 iterations. The alignment was prepared using the Molecular Operating System (MOE 2007.09, Chemical Computing Group, Inc.) using the Flexible Alignment function with both molecules, following a conformational minimization using MOE default settings.14
