Figure 1.

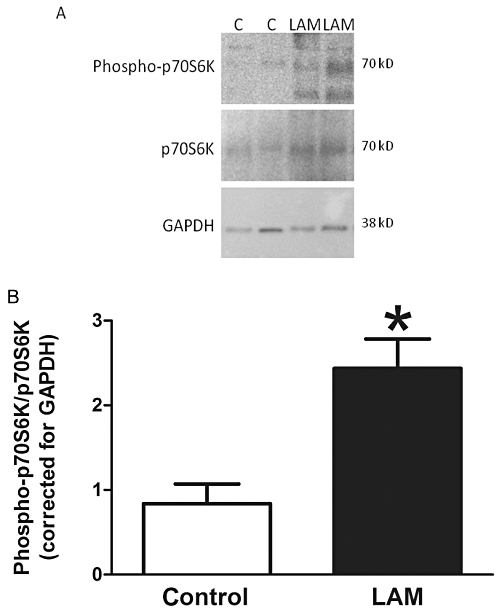
Phospho-p70S6K levels in control (n = 4) and lymphangioleiomyomatosis (LAM) (n = 4)-derived cells. (A) Representative Western blot of phospho-p70S6K, p70S6K and GAPDH. (B) Mean data ± SEM. *Significant difference from control; C = control.

Phospho-p70S6K levels in control (n = 4) and lymphangioleiomyomatosis (LAM) (n = 4)-derived cells. (A) Representative Western blot of phospho-p70S6K, p70S6K and GAPDH. (B) Mean data ± SEM. *Significant difference from control; C = control.