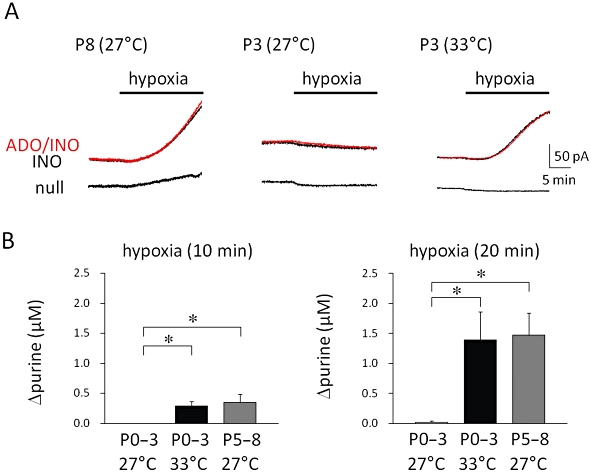
Figure 7.

Adenosine release from spinal cord during hypoxia. Adenosine/inosine (ADO/INO), inosine (INO) and null sensors were inserted into the dorsal horn of the spinal cord and then hypoxia was applied for 20 min. (A) Representative traces of signal current for each sensor observed in a postnatal day 8 (P8) rat at 27°C (left panel), postnatal day 3 (P3) rats at 27°C (middle panel) and 33°C (right panel) are shown. (B) The hypoxia-evoked change in adenosine/inosine concentration (Δpurine) at 10 min (left panel) and 20 min (right panel) after hypoxia in postnatal day 0–3 (P0–3) rats at 27 and 33°C and in postnatal day 5–8 (P5–8) rats at 27°C. Each symbol and error bar represents the mean ± SEM (n = 5–6). *P < 0.05 versus P0–3 rats at 27°C (Dunnett's test).
