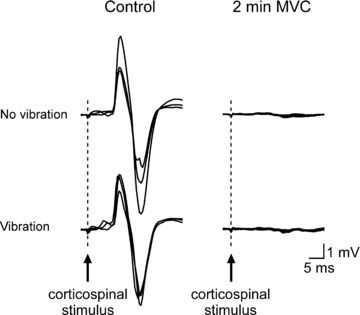
Figure 4. Individual traces of CMEPs in the silent period recorded from a single subject during brief control MVCs and a sustained 2 min MVC.

Mean traces of the three conditioned CMEPs with and without vibration are displayed in the left panel. Five responses obtained with (30, 50, 70, 90 and 110 s) and without (40, 60, 80, 100 and 120 s) vibration during the 2 min MVC are overlaid in the right panel. During the sustained effort, conditioned CMEPs were markedly reduced and of similar size both with and without vibration.
