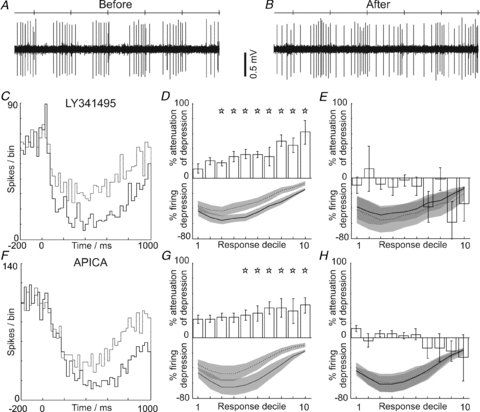
Figure 1. mGluR2 antagonism attenuates Golgi cell responses evoked by peripheral afferent stimulation.

A and B show excerpts of raw data from an example Golgi cell during hindlimb stimulation (stimulus times indicated by ticks on the top line), before and during iontophoresis of LY341495. Note the attenuation of the evoked long-lasting depression response. The PSTHs shown in C summarise the data for the cell illustrated: before (continuous line) and after mGluR2 antagonism (broken line) with LY341495. Note the attenuation of the depression. D summarises grouped data (n = 18). The lower panel shows the normalised mean firing depression before (continuous line) and after mGluR2 blockade (broken line) – grey areas indicate 95% confidence intervals, error bars represent 2 standard errors from the mean. The upper panel shows the percentage attenuation of the response, with significant attenuation (indicated by stars) across deciles 3–10 of the responses; E, no significant changes in response occurred with vehicle administration. F–H, plot data in the same format as C–E for an alternative mGluR2 antagonist, APICA. G, shows grouped data for 11 cells.
